#anscombe's_quartet
Anscombe's quartet
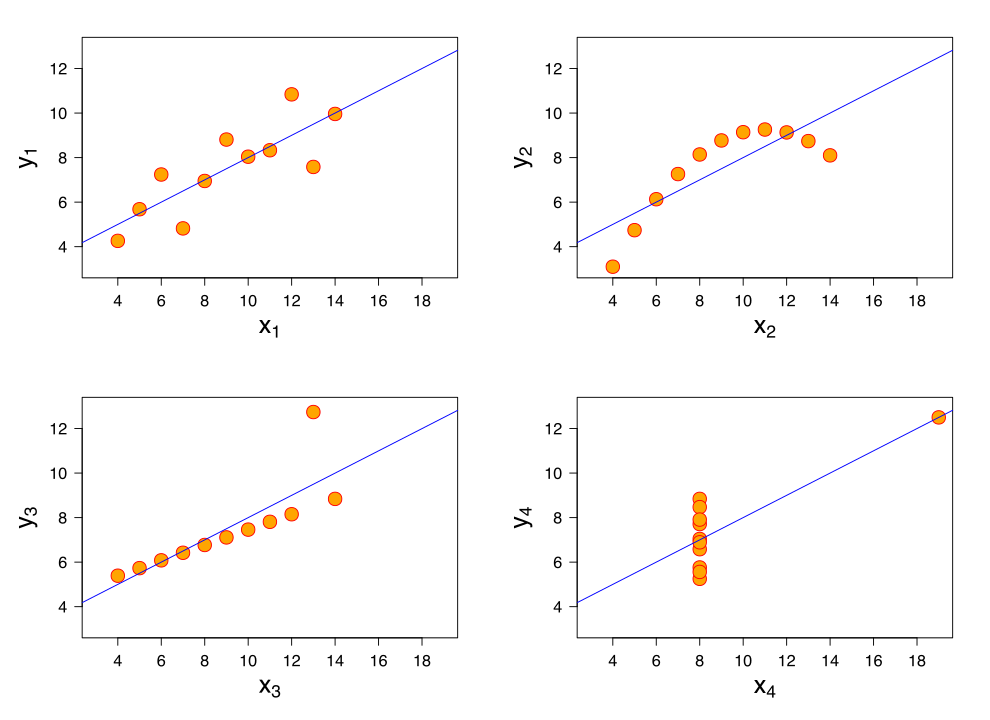
Four data sets with the same descriptive statistics, yet very different distributions
Anscombe's quartet comprises four datasets that have nearly identical simple descriptive statistics, yet have very different distributions and appear very different when graphed. Each dataset consists of eleven (x, y) points. They were constructed in 1973 by the statistician Francis Anscombe to demonstrate both the importance of graphing data when analyzing it, and the effect of outliers and other influential observations on statistical properties. He described the article as being intended to counter the impression among statisticians that "numerical calculations are exact, but graphs are rough".
Tue 23rd
Provided by Wikipedia
This keyword could refer to multiple things. Here are some suggestions: